Untangle the JavaScript spaghetti code with YellowLabTools
As a front-end architect and freelancer, I often do performance audits for websites. One recurrent problem is dealing with page making a heavy usage of JavaScript. They can load up to dozens of scripts, including:
- non-documented and non-commented jQuery or vanilla JS code,
- jQuery plugins doing some magical transformations to the DOM,
- over-minified external scripts the marketing said « it’s just a small tag, don’t worry ».
How to audit that? How to understand what’s happening on the page? In-browsers JS profilers are nice when you want to detect the slowest functions included in all the scripts, but they are of no help if you need to understand why these functions are so slow.
Phantomas
I played a lot with Phantomas (by Maciej Brencz). In case you don’t know this tool, it’s great. It loads a page with PhantomJS (a headless browser), analyzes various aspects of the page and outputs metrics about performances and quality.

I was fascinated by the fact that it can detect and count JavaScript interactions with the DOM. But counting is not enough, I wanted to have more information:
- When did the DOM interactions happen during page load?
- Which script and which function made the call?
- Could I detect any kind of redundancy, any unoptimized loops?
So I wrote a Phantomas module that logs everything: DOM queries, readings, writings, bindings.
Erm not exactly everything…
Actually only functions can be intercepted. Assignments such as « element.className = ‘foo’ » are not caught (maybe one day with MutationObserver).
It also records most of jQuery’s functions, the ones that interact with the DOM.
Yellow Lab Tools
When profiling a webpage, there can be thousands of DOM interactions, that are hard to analyze. It needed an HTML UI, and that’s what Yellow Lab Tools brings in.
After launching a test click on the “JS Timeline” menu button. You’ll see a timeline that looks like this (example with www.aol.com):
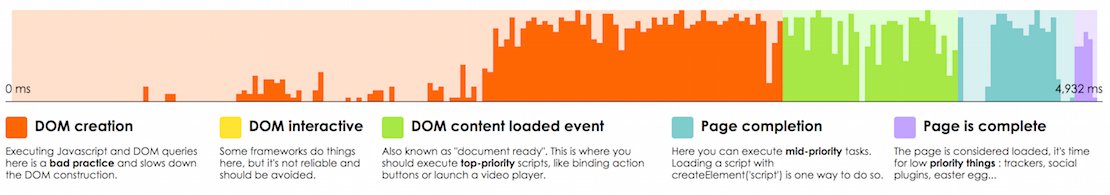
This timeline shows the loading of the page. Each bar represents a bunch of JavaScript interactions with the DOM.
The page loaded in 4,932ms, but it looks like JavaScript took half of this time! Don’t worry, there aren’t 2.5 seconds of JS execution when you load www.aol.com on a real browser. It’s 3 or 4 times faster. Spying some JavaScript with some more JavaScript necessarily slows down the execution.
So what can we see on this timeline?
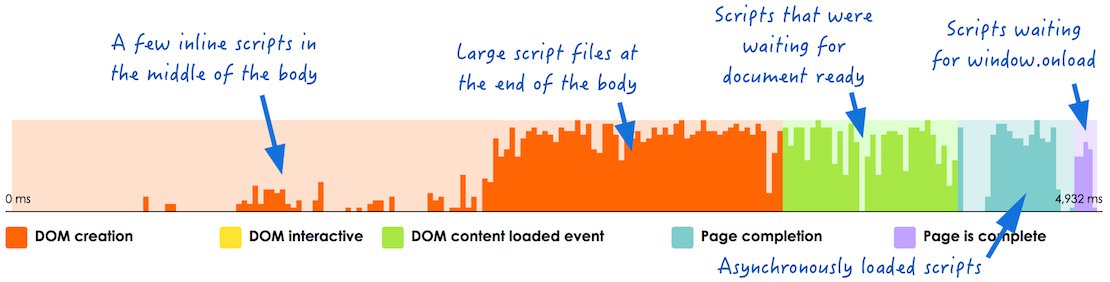
Want a piece of advice here? Avoid manipulating the DOM before it is completely rendered. Which means no scripts in the middle of the body.
For the rest, do whatever you want but prioritize wisely. Use the visually colorated steps to organize your JS execution by priority. For example binding the login button in your header could be one of the first actions, so place it at the end of the body. Binding some buttons in the footer can probably wait until « window.onload ».
And of course the main rule is reduce the number of DOM interactions. AOL’s home page has 2,000 of them and that’s a lot.
Profiling details
Below the timeline Yellow Lab Tools provides the entire list of recorded DOM interactions. This example is the beginning of google.com — short and efficient:
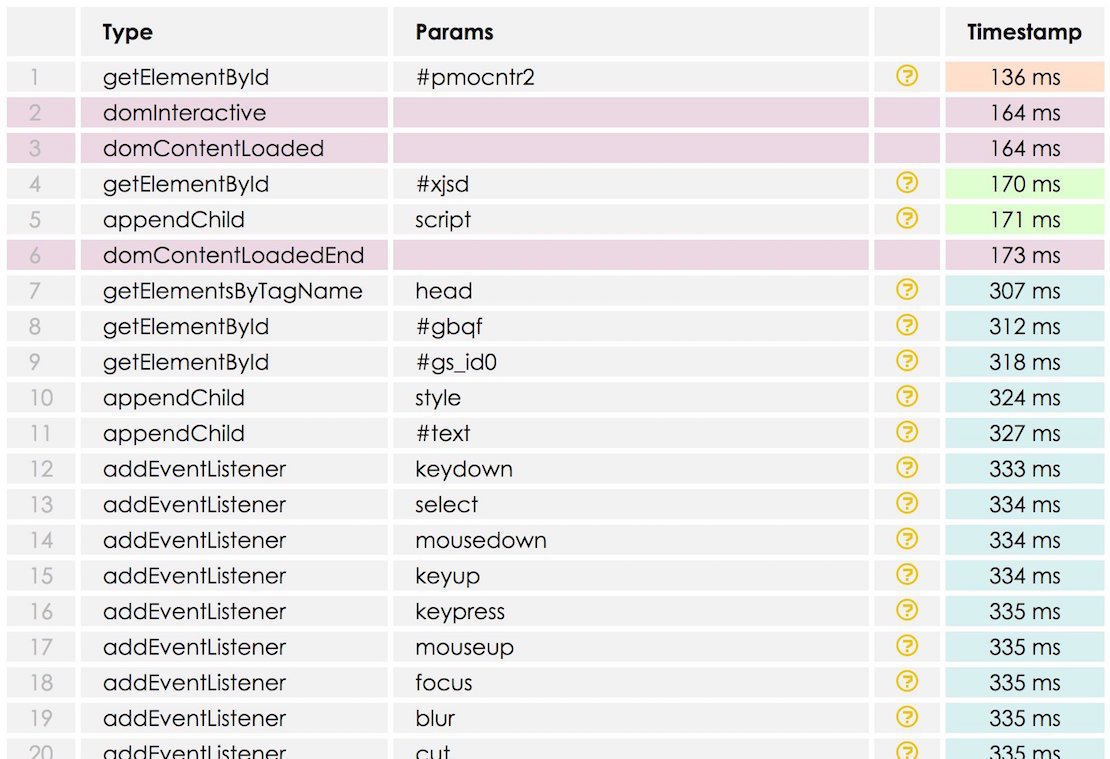
On each line you can show more information — such as the JS call stack — by clicking on the question mark symbol.
How to use Yellow Lab Tools?
It’s online, it’s free and it’s open-source: YellowLab.tools.
Common bad practices i’ve seen
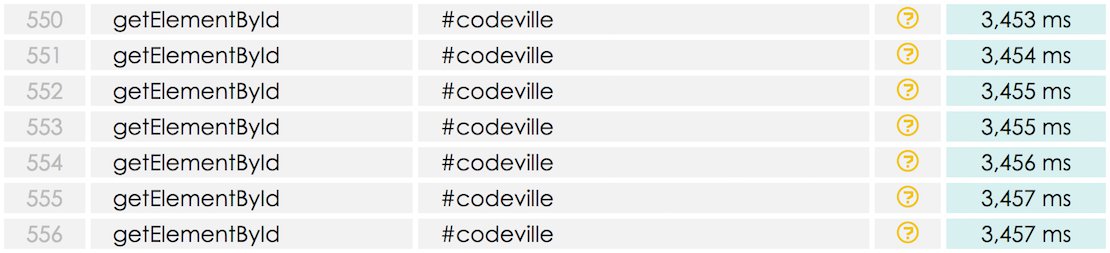
1. The duplicated queries
The result could be put into a variable to avoid queries :
2. The dead (or useless) JS code
A red warning icon on a line means:
- the query didn’t return anything
- an action is called on an empty jQuery object.
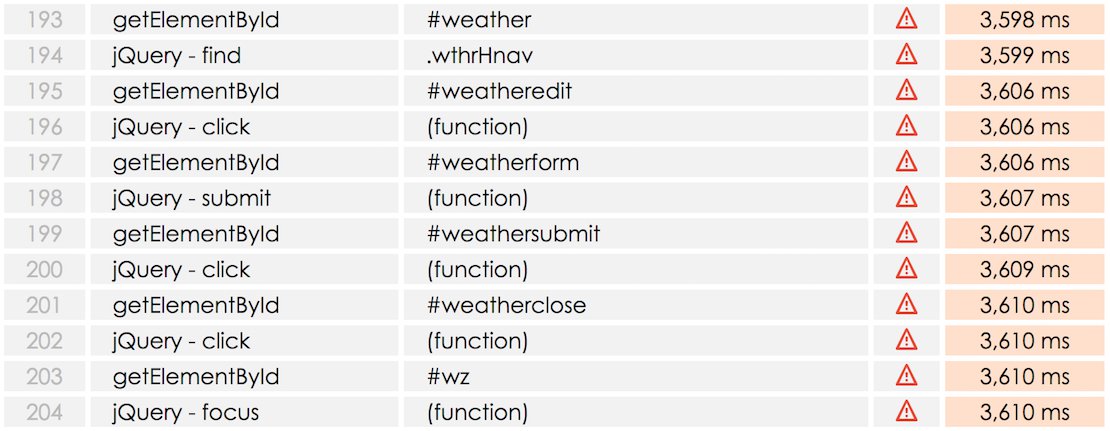
The following extract is probably a piece of code meant for another page:
3. Many elements binded one by one
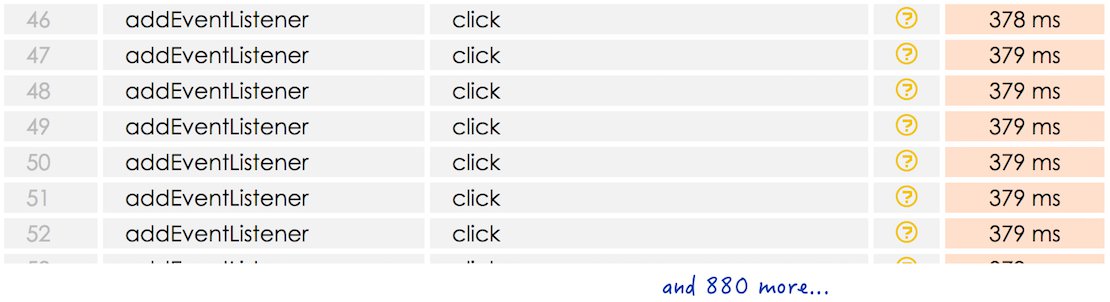
On the following extract, a tracker binds 887 click events and it takes 104ms. If you are binding more than 5 elements, consider using event delegation.
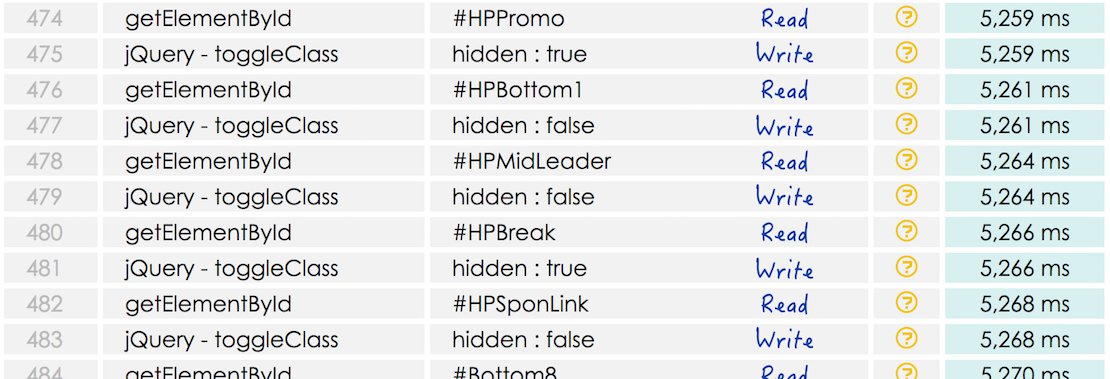
4. The read/write loop
Modern browsers optimize the JavaScript execution by buffering the writing DOM queries. But before executing a reading query, the browser needs to clear the writing buffer.
If you want to take advantage of this behavior try to group reading queries together and writing queries together, not like the following example:
5. The heavy jQuery plugin
When developers add a plugin to a page, they generally don’t read its code. They’re just happy it does what they need at the time. But some plugins have huge performance impact or are a clear overkill.
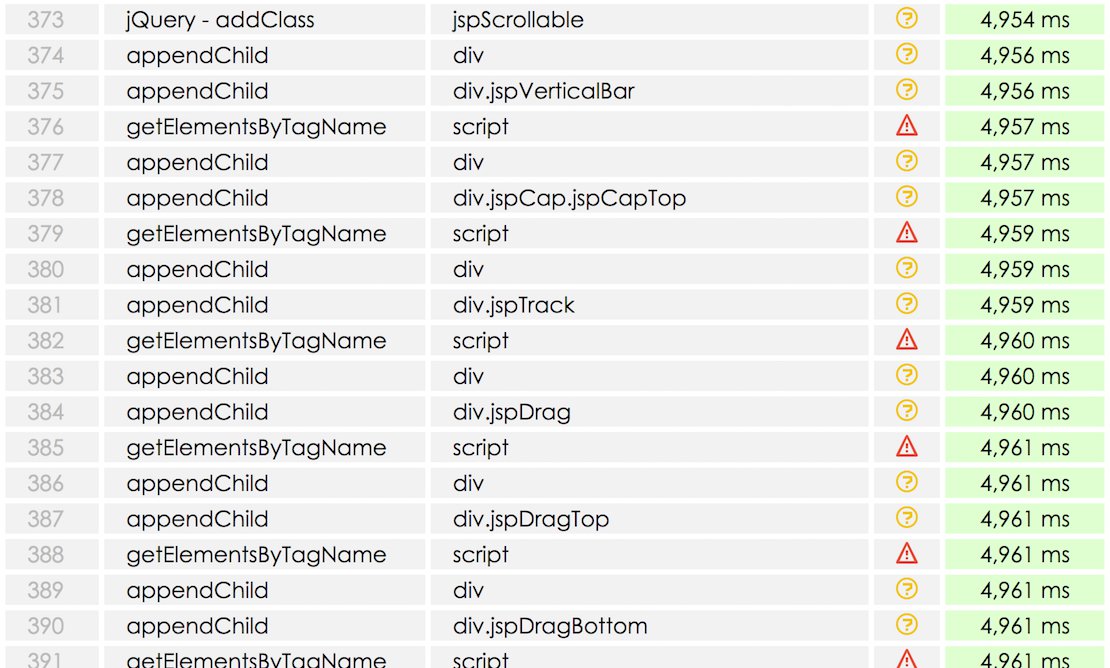
The following extract shows the jScrollPane plugin in action on a page. Just a part of it, because it makes 446 interactions and it lasts for 229ms.
What’s next for Yellow Lab Tools?
I’ll keep on improving the tool. Please give your opinion and report bugs by opening tickets on the GitHub project page.
I also have ideas for its future:
Add intelligence: because analyzing long listings is fastidious. Every recursive pattern seen in the profiler looks like it is optimizable. So we could probably build some intelligent problem detection algorithms.
Diversify: I plan to add more tools inside YLT, for deep CSS analyzing, image optimizations… I know there are already plenty of tools on the market, but I like tools that go deep into the details, like for example the JS profiler does.
Thanks for reading, and I hope you enjoy my tool!
Update 2015/01/11: v1.1 is out, i had to change a few lines in this article.
Special thanks to Stefan Judis — creator of perf-tooling.today — for reviewing this article. And thank you Maciej Brencz — creator of Phantomas and Analyze-CSS — for your excellent tools